Building RCA Charts
Use the following steps to build an RCA chart.
- On the Analysis Tab, select Root Cause Analysis from the Analysis Type drop-down list.
- Select an option from the Variable Picker (i.e. Availability, Performance, or Quality).
- Select a machine from the Asset Picker.
- Select a date from the Date Filter.
- Click the Add Filter Picker to select any added filters.
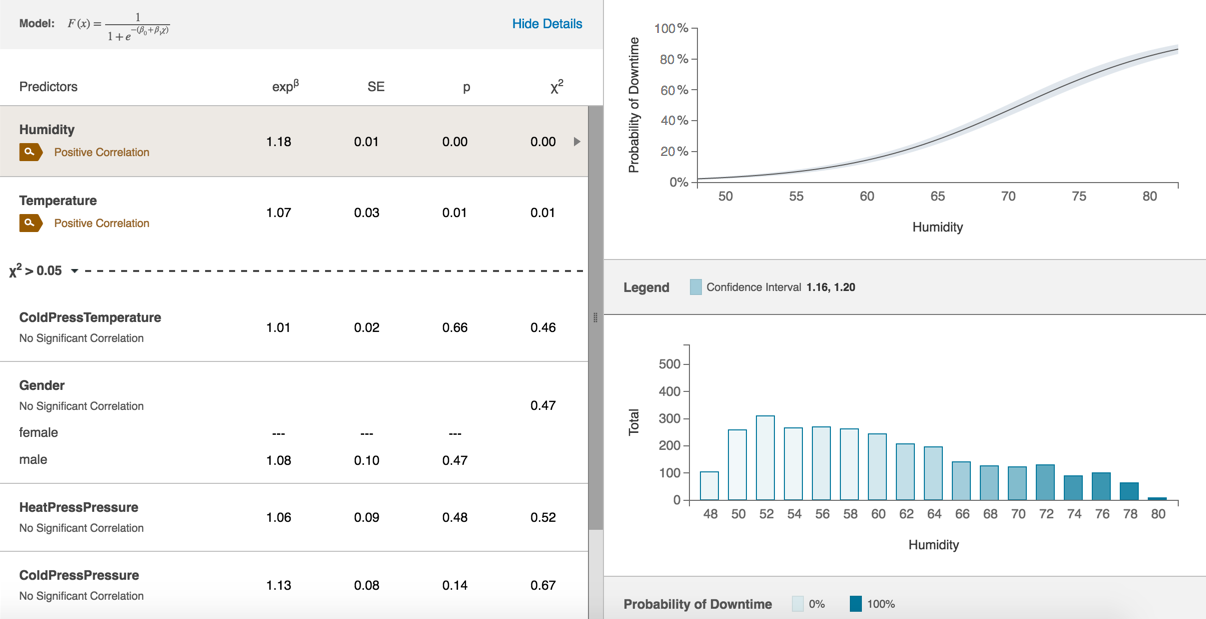
Click Update to display the charts. Predictor variable correlations are on the left, and on the right, a confidence graph is at the top with a histogram below it.
Note: The confidence graph and histogram display data for the variable selected in the Predictors table.