Data Tab Navigation
On the Data tab, Filter Bar options differ based on the data type selected:
- Cycles
- Defects
- Downtime
OEE
Note: See Other filters for Filter Bar options.
General Data Tab navigation allows you to:
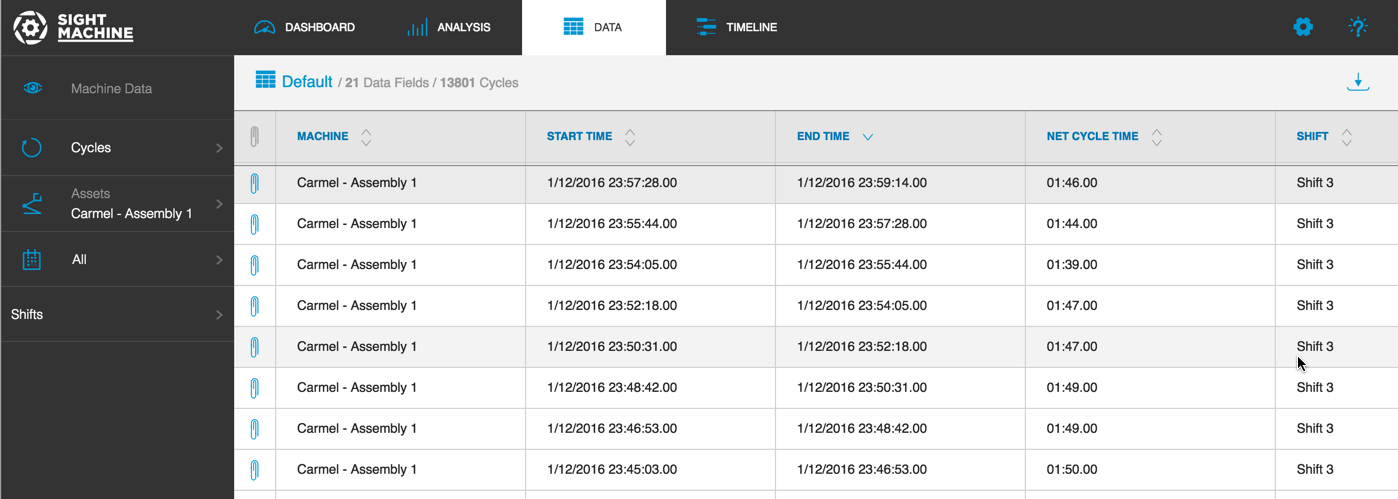
- Sort the displayed data in ascending or descending order by selecting the up\/down arrow icons next to the column labels
- Click and drag to adjust column width
- Hover, click, and drag to re-position columns
Exporting Data
The Export Data button displays on the Data Tab in the upper right corner of the screen. The Export Data button exports the displayed data as a comma-separated value (.csv) document.
To export data, click the Export Data icon in the upper-right of the screen to automatically downalod a .csv file of the data.

Navigate to your computer's default download directory to locate the downloaded file. Or, depending on your operating system\/browser, you may see the downloaded .csv file in the footer of the browser.
Double-click the .csv file to open it. Or, click the .csv file and select the application with which you want to open the file.
Note: Most .csv files default to a spreadsheet application, such as Microsoft Excel, etc.
Cycles Data Navigation
When you choose Cycles from the Data Type selector the data displays in tabular form by default.

See Filtering Data Tables for other filter options.
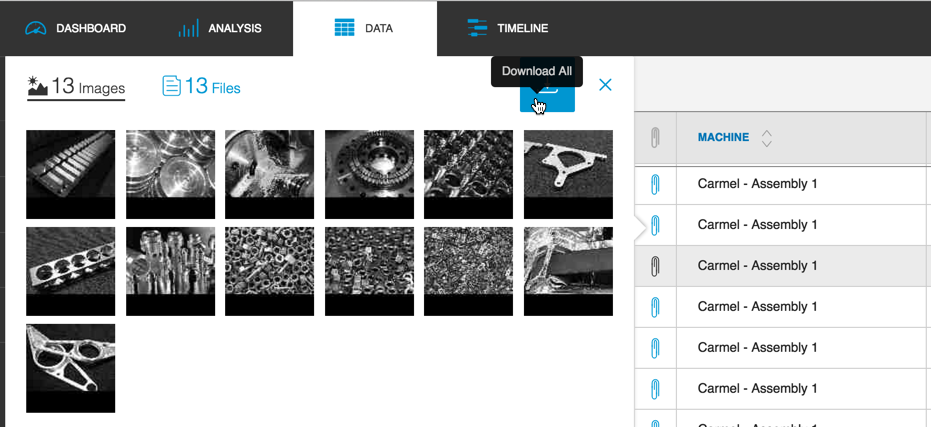
Any row that has an Image icon (Paperclip icon) allows you to click, view, and download that image.

Defects Data Navigation
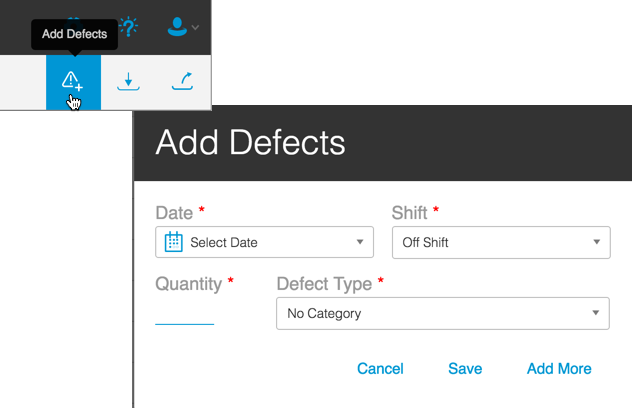
An Add Defects icon appears in the upper right of the screen when you choose Defects from the Data Type selector. You can use the Add Defects icon\/dialog box to add a new defect.

In the Add Defects dialog box:
- Select the values from the Date\/Shift\/Defect Type drop-down lists.
- Enter a values in the Quantity field.
- Click Save to save the defect or click Add More to add more defect types.
- Once you save your values, the Add Defects dialog box closes and focus returns to the Data Tab.