Output Chart
Actual output as a percentage of expected output appear as a bar chart on the Dashboard tab's Output subtab. Use the following steps to refine and view Output metrics from the Dashboard tab.
Note: The Output subtab may appear differently than in the image below. A unique name specific to your organization may display instead.
- On the Dashboard Tab, select an asset and date from the Filter Tab and click Update.
- Click the Output subtab to display the Output chart.
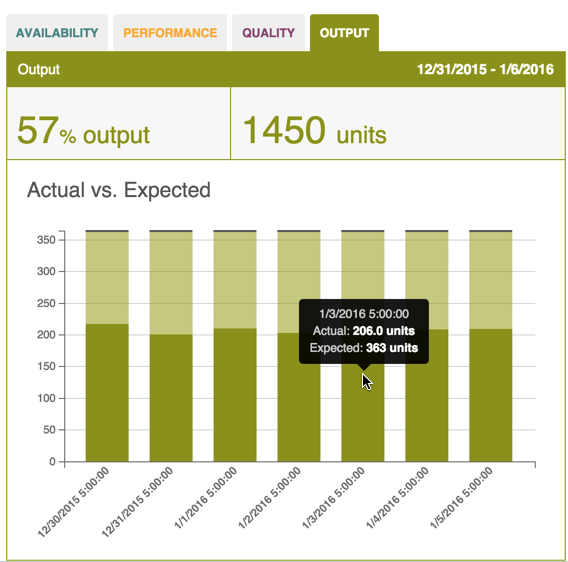
- A total percentage of output for the cycle and the total number of units display at the top of the subtab.
- Hover over the bar chart bars to see pop-up text with the total number of actual output to expected output by day.