Viewing Cycle Timeline
The cycle timeline displays in the top pane of the Timeline Tab.
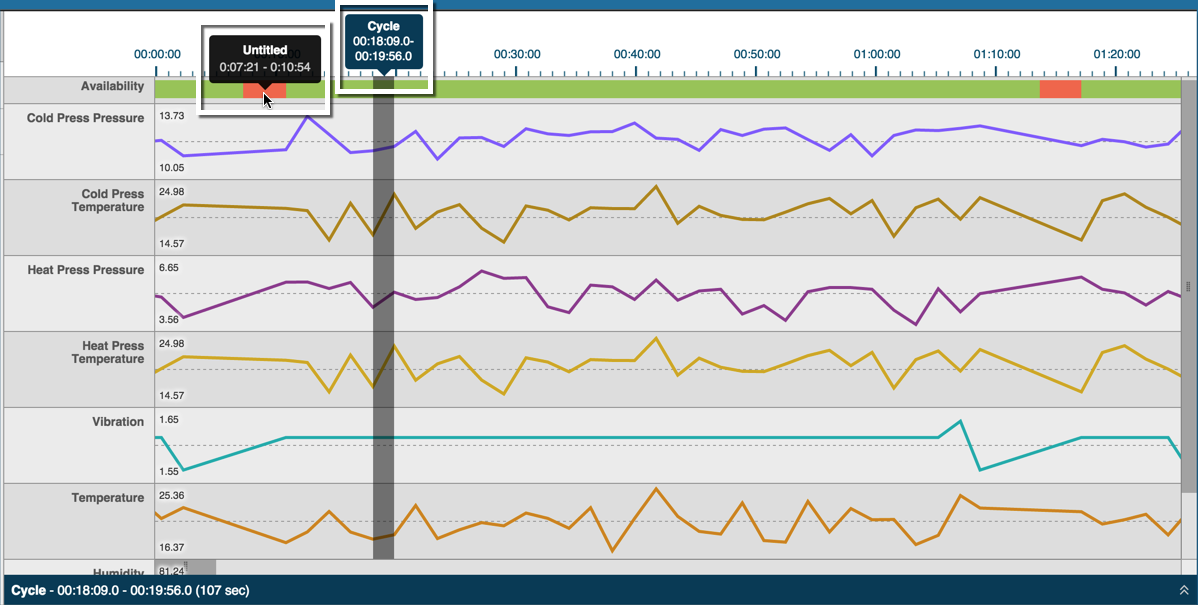
Click on the Availability row (top) to display a gray-shaded, vertical bar that shows the selected time range. The cycle time range displays in pop-up text above the row and at the lower left of the cycle pane.
- Downtime appears as red-shaded sections in the Availability row. Hovering over downtime displays pop-up text with the beginning and ending downtime range.
- A row for each machine measure displays under the Availability row. Each row is labeled by measure (i.e. Cold Press Pressure, Temperature, etc.). A corresponding line graph for the measure appears for each row to the right, color coded and for a 24-hour period.
- At the beginning of each line graph, numeric high and low values display for each measure.
- Scroll up and down to see all measures, or left to right to see the entire 24-hour line graph.
Hover over any red sections of the Availability row to display pop-up text displaying the actual availability.