Dashboard Tab Navigation
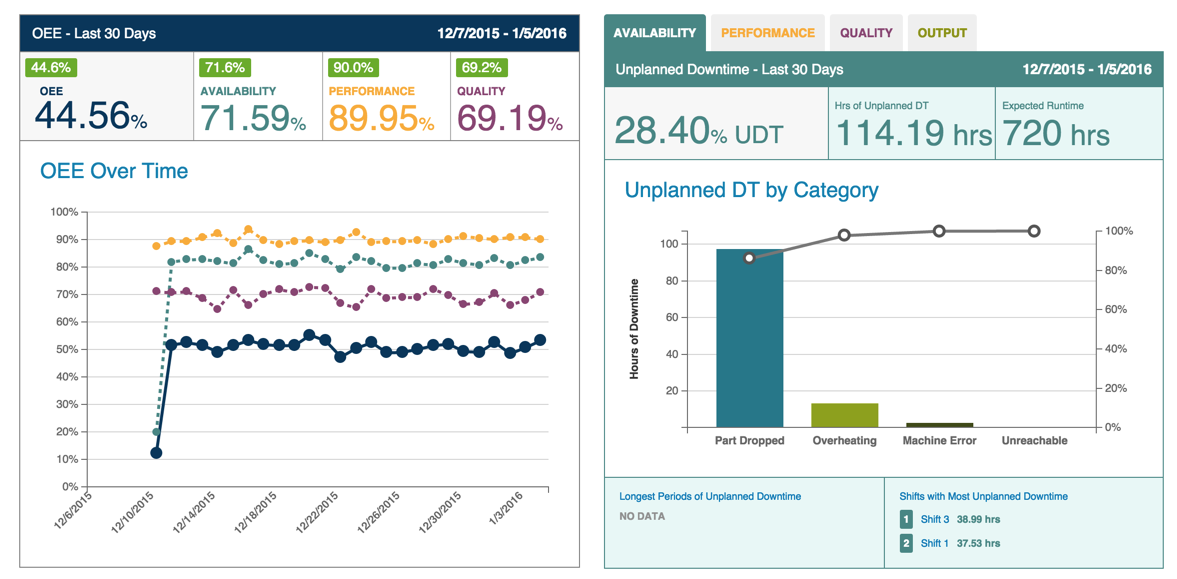
On the Dashboard tab, data displays in two panes:
- OEE Pane
- Tabbed Pane
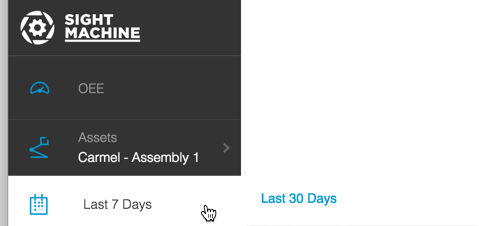
The data displayed in these panes represents the asset and date range selected in the Filter Bar. For the data displayed above, "Decatur - Assembly 1" was selected from the Asset Selector and "Last Month" was selected from the Date Picker (see image below).
OEE Pane In the OEE pane, equipment efficiency displays for the machine and time you selected in the Filter bar. Linked text in this pane allows navigation to other tabs where you can see more detailed information.
- Clicking the OEE Over Time link takes you to the Analysis Tab
- Clicking the Availability, Performance, or Quality linked text takes you to the Data Tab
- Clicking any of the line graphs in the OEE OVer Time chart also takes you to the Data Tab
When you navigate to any of these other tabs, you must click the Update button upon arrival to see detailed information.
Tabbed Pane In the Tabbed Pane, you see OEE in its component parts. These parts display as subtabs: Availability, Performance, Quality, and Output.
Availability subtab:
- Click the Unplanned DT by Category link to go to the Analysis Tab
- Click the bars or line graph go to the Analysis Tab
- Click the Longest Periods of Unplanned Downtime, Shifts with Most Unplanned Downtime, or individual Shift links to go to the Data Tab
Performance subtab:
- Click the Performance by Shift link to go to the Analysis Tab
- Click any of the bars in the bar graph to go to the Data Tab
Quality subtab:
- Click the Defects by Type link to go to the Analysis Tab
- Click any of the bars in the bar graph or the line graph to go to the Data Tab
Output subtab: The Output subtab displays a bar graph and does not include links to other Tabs.