Quality Chart
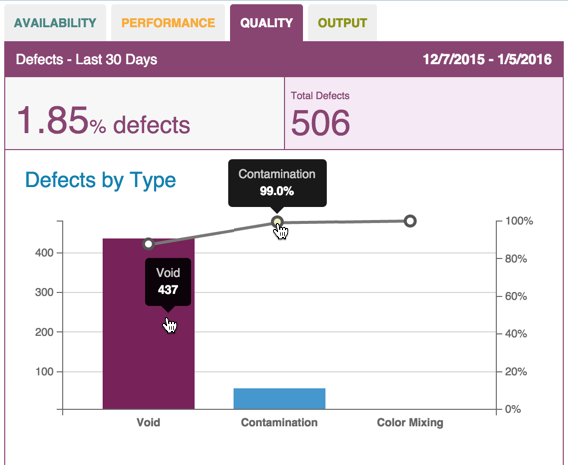
Defects by type appear as a bar chart on the Dashboard tab's Quality subtab. Use the following steps to refine and view quality metrics from the Dashboard tab.
Note: The Quality subtab may appear differently than in the image below. A unique name specific to your organization may display instead.
- On the Dashboard Tab, select an asset and date from the Filter Tab and click Update.
- Click the Quality subtab to display the Quality (Pareto) chart. Defects by type display as a percentage of cycle time.
- Hover over the bar chart bars to see the total number of defects by defect type for the cycle.
- Hover over the line graph points to see the percentage of defects for that type for the cycle.
- Clicking the bar chart or line graph displays the Data Tab. On the Data Tab, a table view of the defects by type displays more detail.